Disease Forecasting
An outlook map for every district
Disease Forecasting answers where disease burden will rise, and when to act. Epidemiologists pick a disease and a window and see the chance of crossing a threshold in each district.
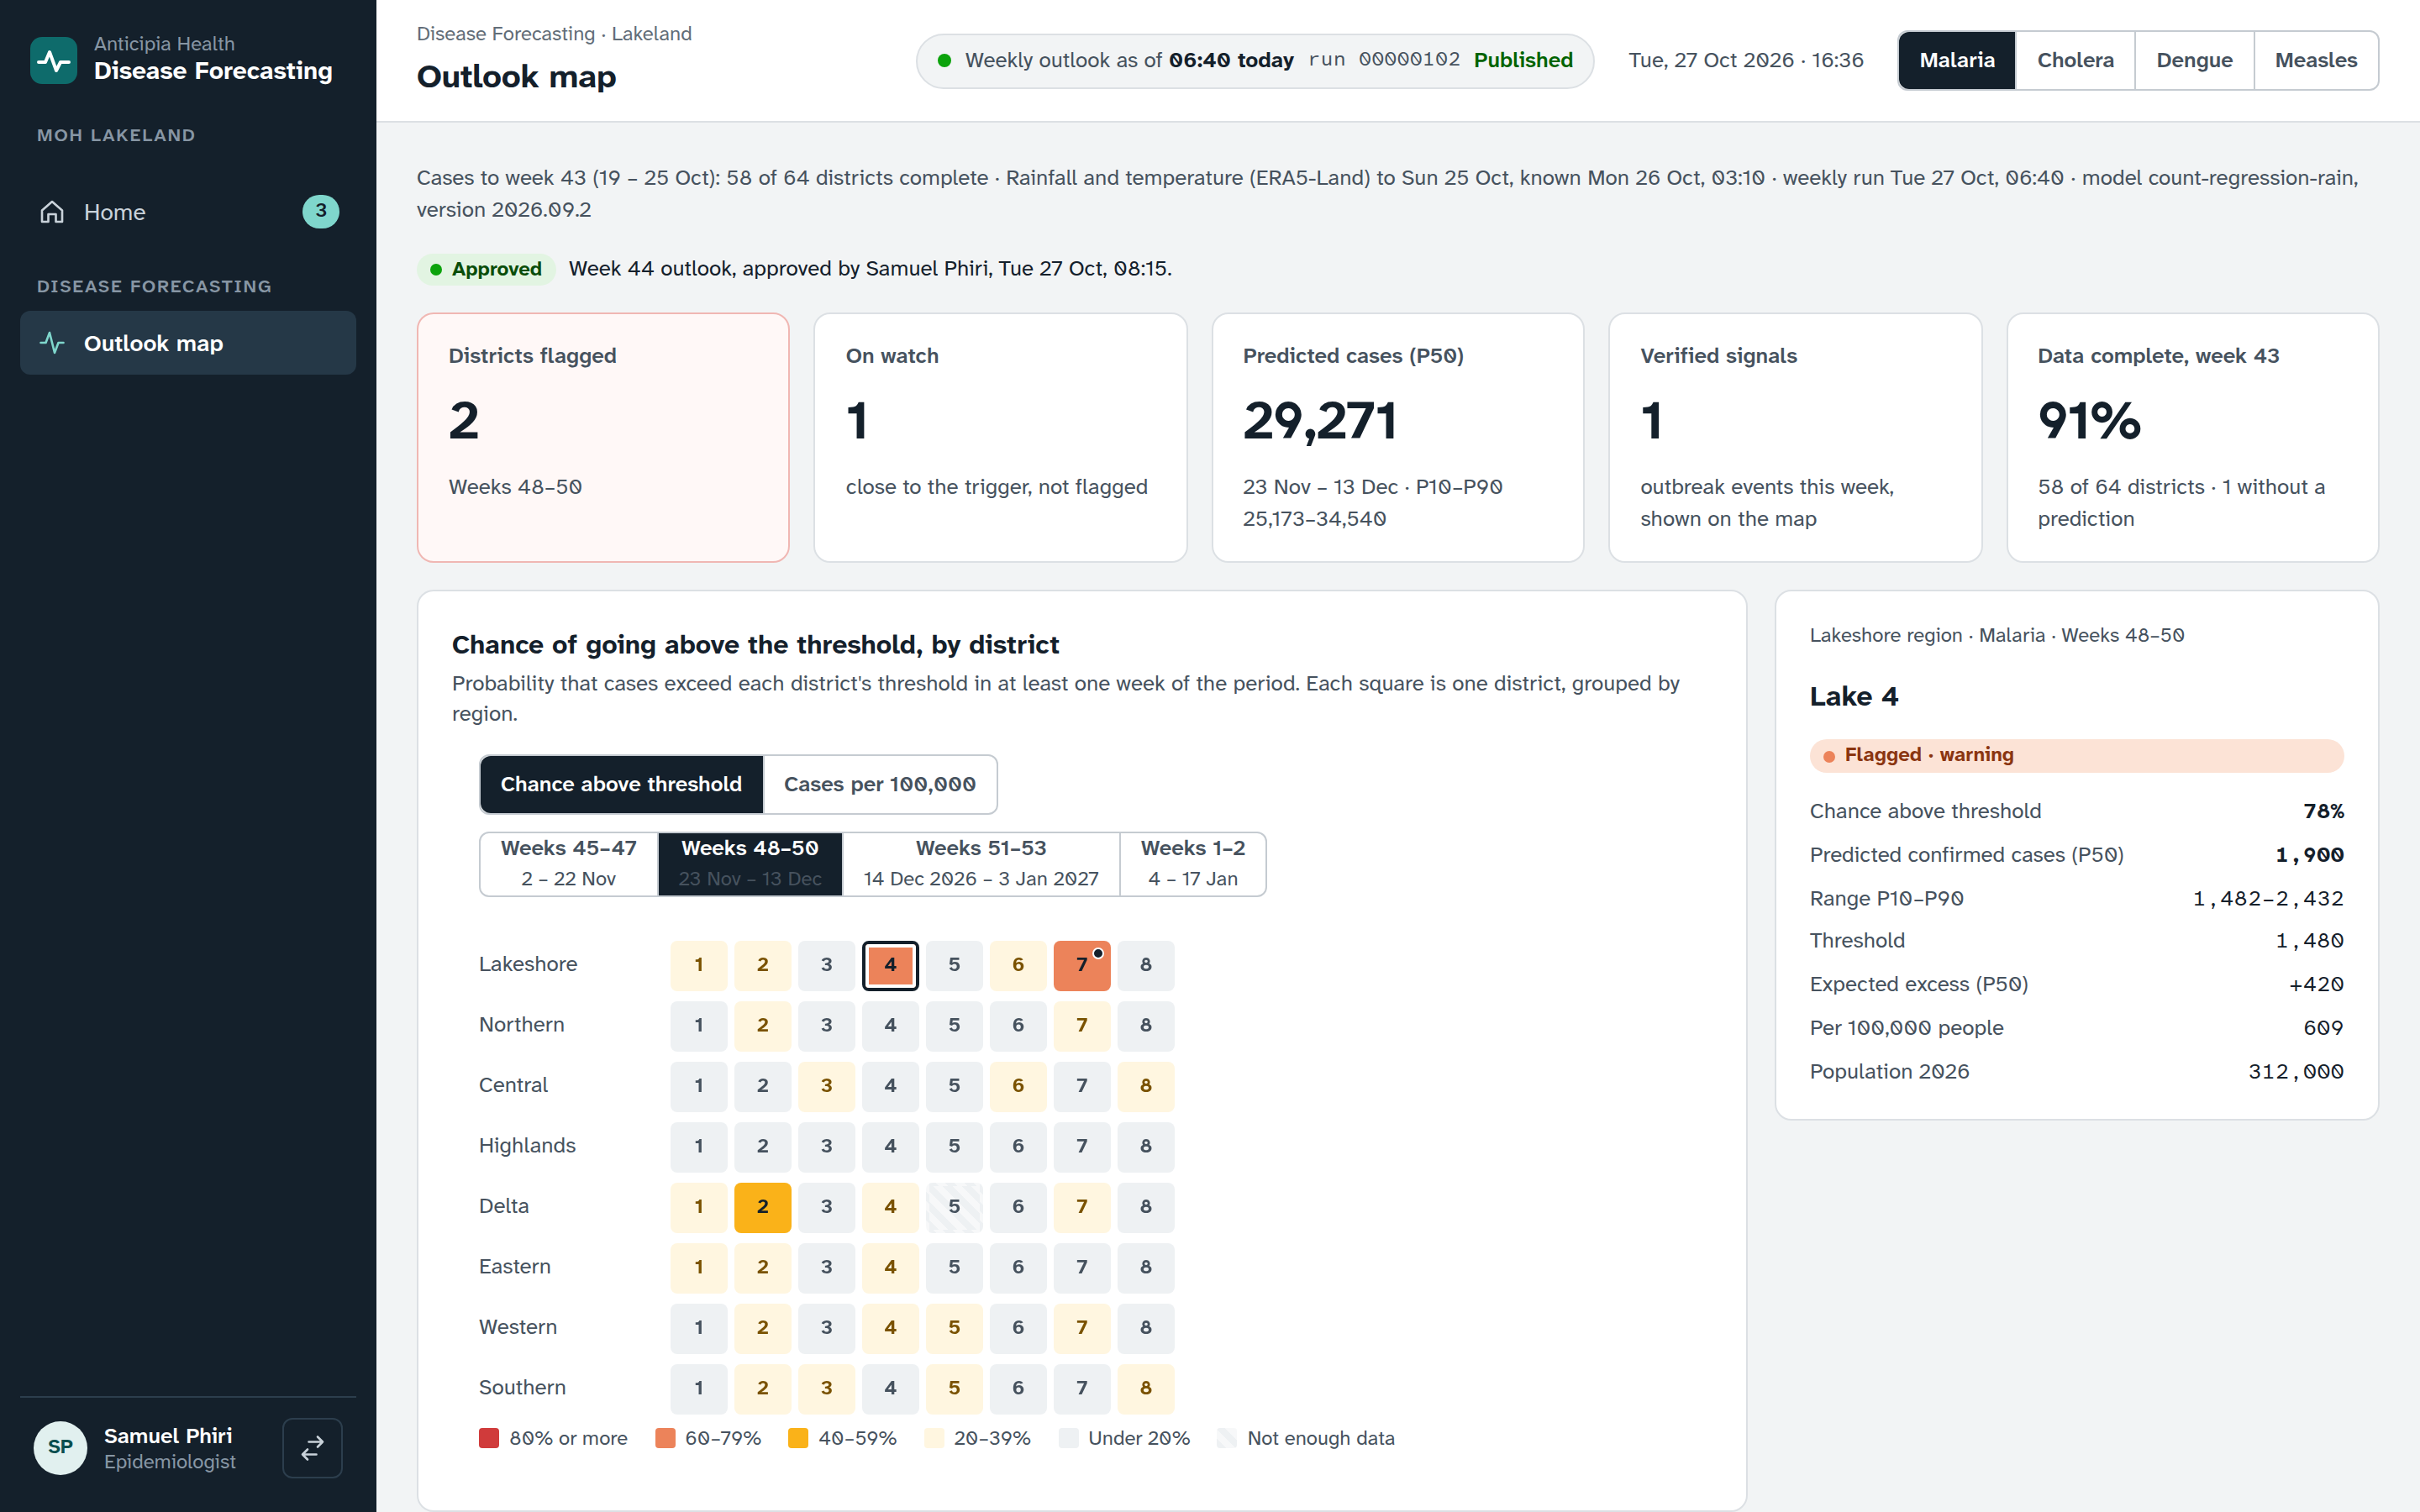
The outlook map
The map shows one tile for every district, grouped by region and coloured by what you ask it to show. Select a district and its figures open beside the map.
Choose a disease and a window
Switch between diseases, and between the weeks ahead that you want to look at. The map and every figure follow the choice.
Choose what the colour shows
Colour the map by the chance of crossing the threshold, or by the predicted rate.
Read a district
Select a tile to see the district’s status, its figures and a note on how to read them.
What the outlook is built from
The page states its inputs before it shows a result. Every climate value shows when it became known, so you can see what the run knew.
On the page
- Case data to the latest complete week, with the districts that have reported.
- Climate data, with the date each value became known.
- The date of the weekly run, and the model behind it.
- Five summary tiles for the outlook as a whole.
Flagged and watched districts
The page lists the districts that need attention in two groups, flagged and watched. The change since the last run makes a district that has moved easy to find, and the response actions put the step after the flag on the same screen.
In each list
- The change since the last run.
- The response actions that apply.
Approved before it is shown
The map shows the current outlook: the newest one that is approved or provisional. A newer draft stays out of sight of everyone except people with the approve permission.
Draft
Each weekly run arrives as a draft. Only people who can approve it see it.
Provisional
Approve as provisional, with a note, and the map shows it as the current outlook.
Approved
Approve the outlook, and it becomes the current one for everyone with access.
On the same platform
Disease Forecasting shares sign-in, roles and the assistant with the other products.
The Ask button in the page header opens the assistant from the map.
Alongside
- Programme Supply Planning for forecasts, plans, funding and stock.
- Rostering for ward staffing, drafted by an optimiser.
See Disease Forecasting working
Book a demo and open the outlook map for a disease, a window and a district.